
| 일 | 월 | 화 | 수 | 목 | 금 | 토 |
|---|---|---|---|---|---|---|
| 1 | 2 | 3 | 4 | 5 | ||
| 6 | 7 | 8 | 9 | 10 | 11 | 12 |
| 13 | 14 | 15 | 16 | 17 | 18 | 19 |
| 20 | 21 | 22 | 23 | 24 | 25 | 26 |
| 27 | 28 | 29 | 30 |
- Codedeploy
- codecommit
- Prometheus
- volume
- emptyDir Volume
- Naver cloud platform
- node exporter
- HTTPS Redirect
- Codepipeline
- SSL Offload
- Persistent Volume Claim
- Codebuild
- Persistent Volume
- aws-dop
- RKE2
- kubernetes
- cicd
- ingress
- ingress controller
- NFS Client Privisioner
- slack
- AWS
- pod
- ncp
- ALB
- k8s
- alertmanager
- DevOps
- emptyDir
- grafana
- Today
- Total
Cloud SA's This and That
[Prometheus] 01 - 구축 Basic (Node exporter, Alertmanager + Slack) 본문
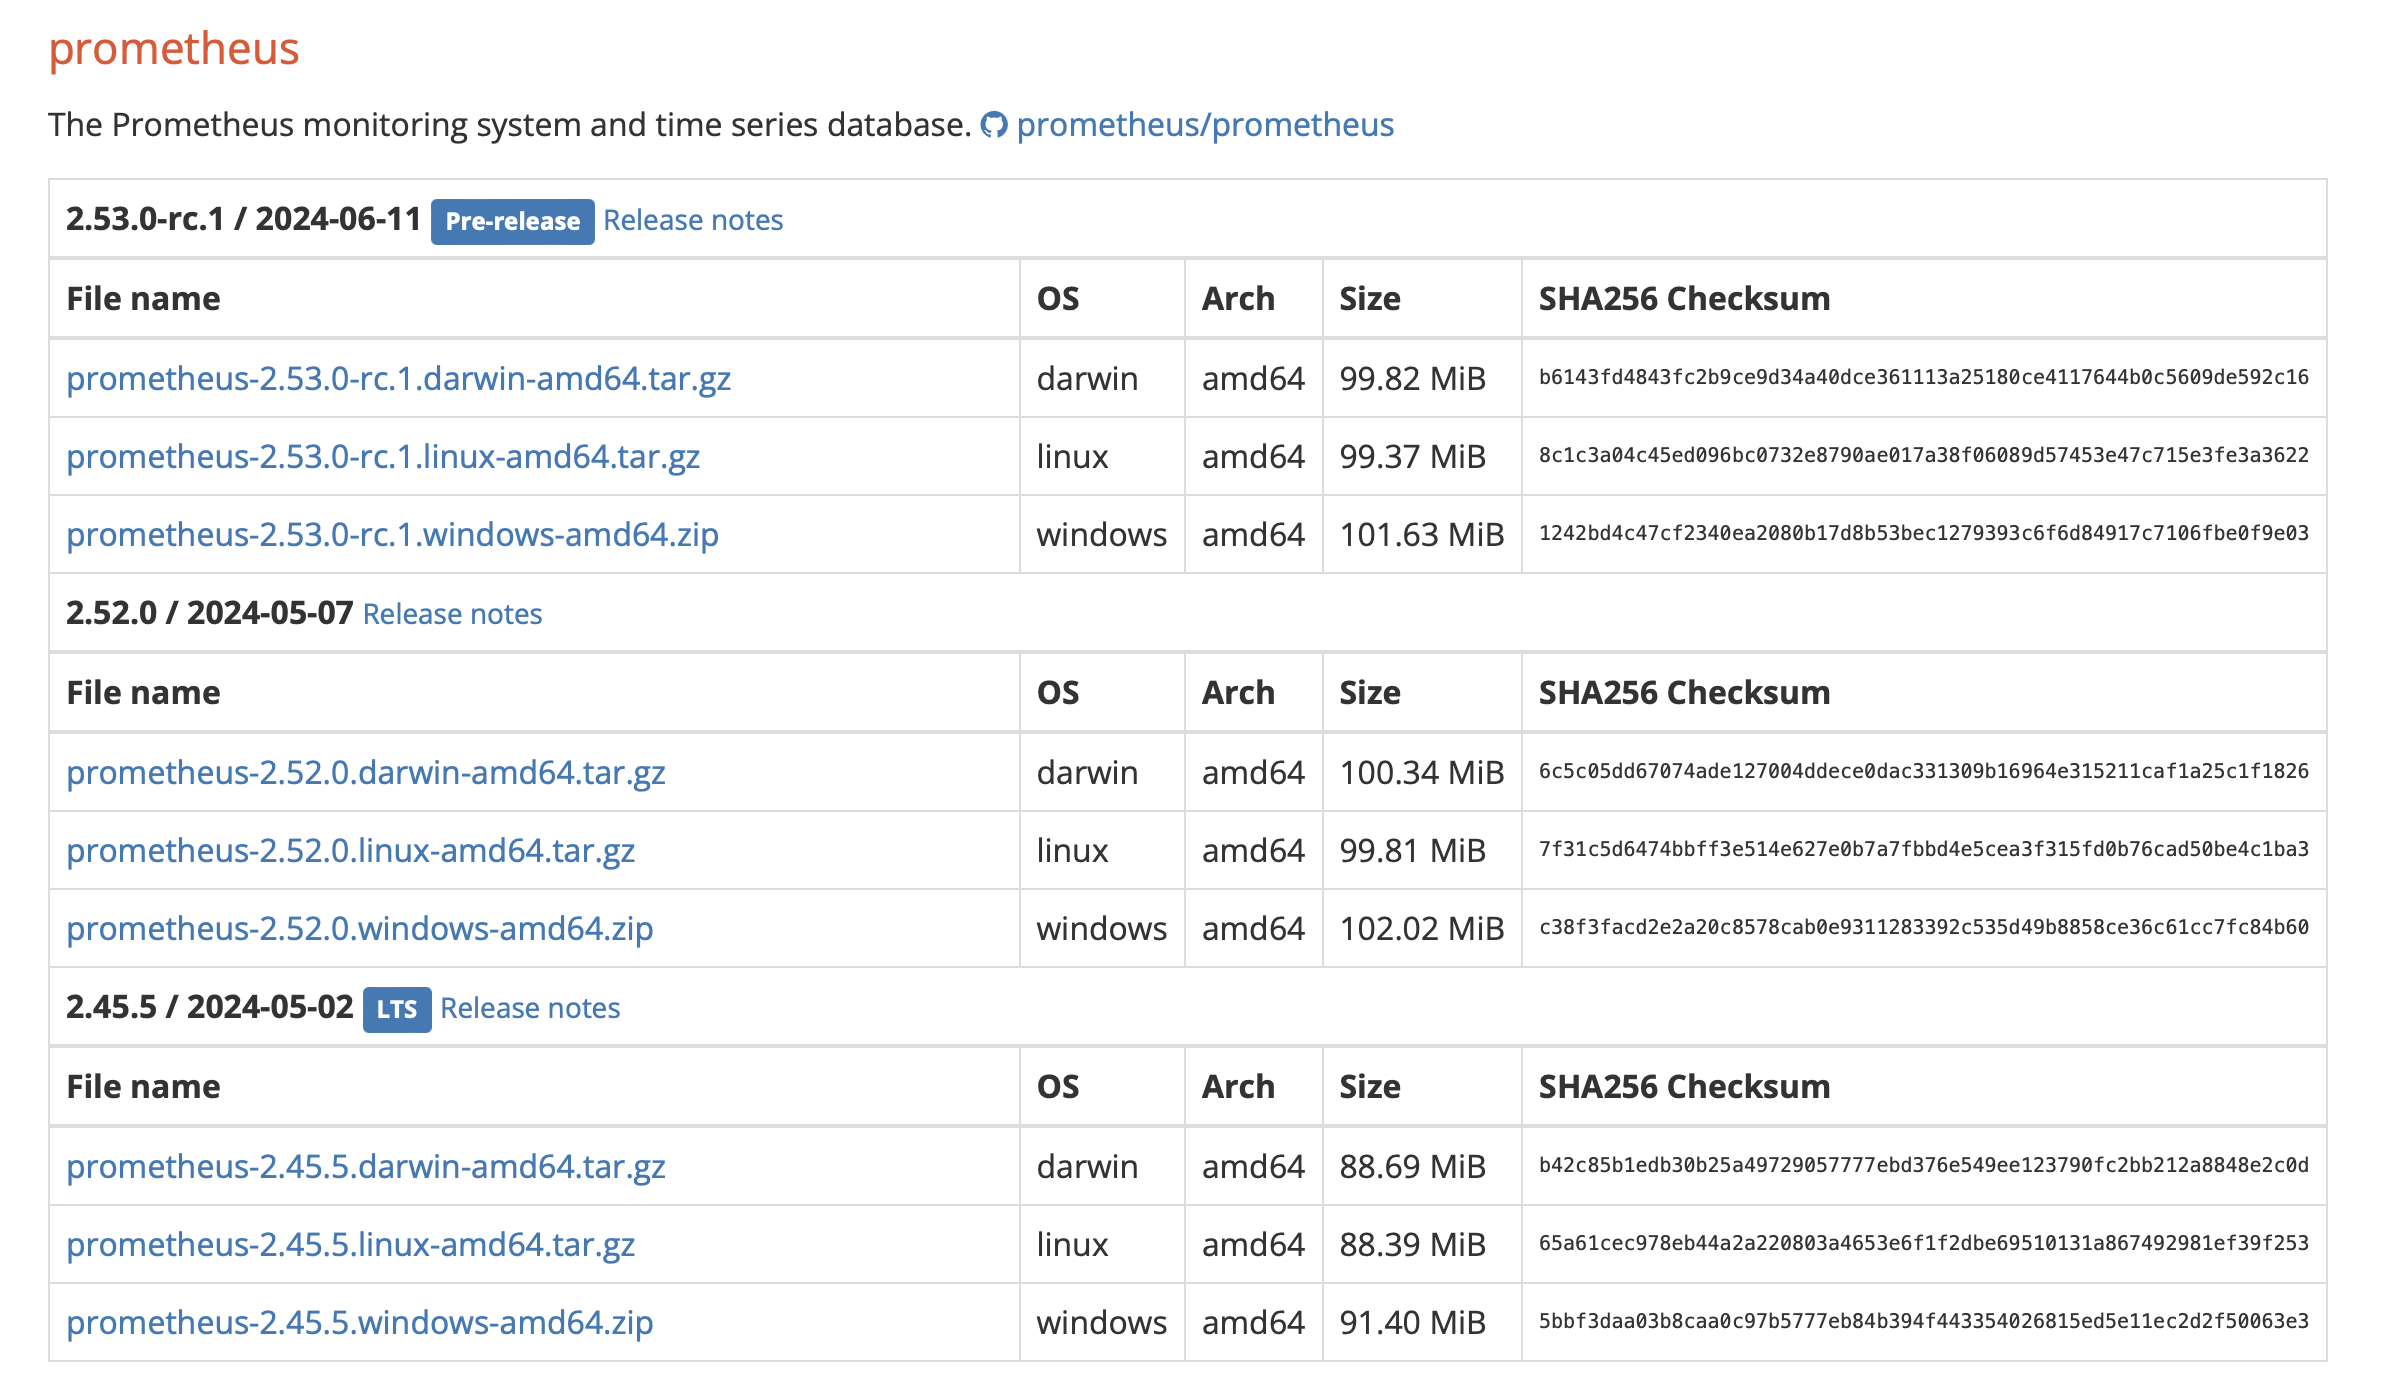
- 설치 공식 사이트 : https://prometheus.io/download/
Download | Prometheus
An open-source monitoring system with a dimensional data model, flexible query language, efficient time series database and modern alerting approach.
prometheus.io
[Prometheus 구축]
- 사용 플랫폼 : NCP
- 구축 환경 : Ubuntu 22.04
1. 설치
$ mkdir /etc/prometheus
$ mkdir /opt/prometheus
$ wget https://github.com/prometheus/prometheus/releases/download/v2.45.5/prometheus-2.45.5.linux-amd64.tar.gz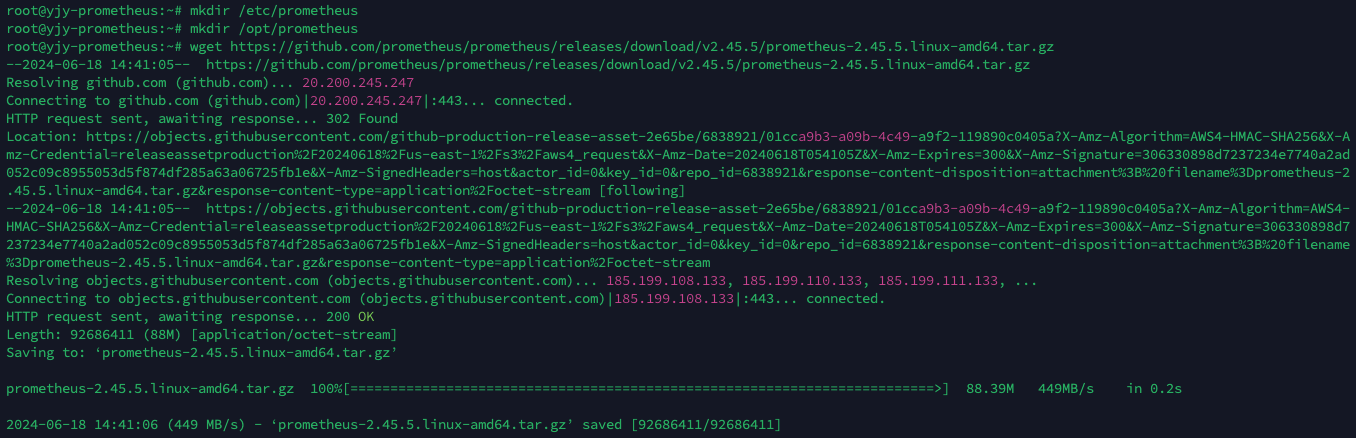
$ tar xvf prometheus-2.45.5.linux-amd64.tar.gz

$ cp prometheus /usr/local/bin
$ cp promtool /usr/local/bin
$ cp -r prometheus.yml /etc/prometheus/
$ cp -r console_libraries/ /etc/prometheus/
$ cp -r consoles /etc/prometheus/

2. Prometheus 서비스 데몬 등록 및 실행
$ vi /etc/systemd/system/prometheus.service
[Unit]
Description=Prometheus
Wants=network-online.target
After=network-online.target

[Service]
User=root
Group=root
Type=Simple
ExecStart=/usr/local/bin/prometheus --config.file /etc/prometheus/prometheus.yml --storage.tsdb.path /opt/prometheus --web.console.templates=/etc/prometheus/consoles/ --web.console.libraries=/etc/prometheus/console_libraries

[Install]
WantedBy=multi-user.target
$ systemctl daemon-reload
$ systemctl start prometheus.service
$ systemctl enable prometheus.service
$ systemctl status prometheus.service

3. Prometheus config 설정
vi /etc/prometheus/prometheus.yaml
# my global config
global:
  scrape_interval: 15s # Set the scrape interval to every 15 seconds. Default is every 1 minute.
  evaluation_interval: 15s # Evaluate rules every 15 seconds. The default is every 1 minute.
  # scrape_timeout is set to the global default (10s).

# A scrape configuration containing exactly one endpoint to scrape:
# Here it's Prometheus itself.
scrape_configs:
  # The job name is added as a label `job=<job_name>` to any timeseries scraped from this config.
  - job_name: "prometheus"

    # metrics_path defaults to '/metrics'
    # scheme defaults to 'http'.

    static_configs:
      - targets: ["localhost:9090"]
4. node_exporter 설치

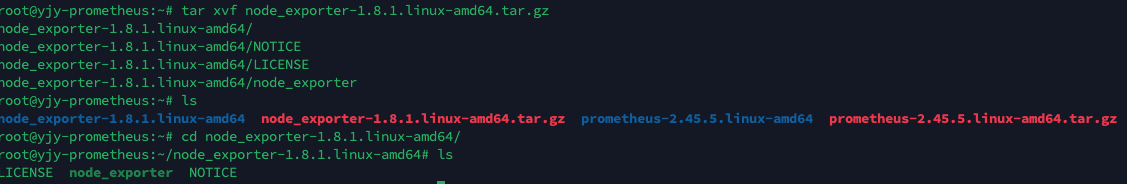
$ wget https://github.com/prometheus/node_exporter/releases/download/v1.8.1/node_exporter-1.8.1.linux-amd64.tar.gz
$ tar xvf node_exporter-1.8.1.linux-amd64.tar.gz
$ cp node_exporter /usr/local/bin


5. Node Exporter 서비스 데몬 등록 및 실행
$ vi /etc/systemd/system/node_exporter.service
[Unit]
Description=Prometheus Node Exporter
Documentation=https://prometheus.io/docs/guides/node-exporter/
Wants=network-online.target
After=network-online.target

[Service]
User=root
Group=root
Restart=on-failure
ExecStart=/usr/local/bin/node_exporter

[Install]
WantedBy=multi-user.target
$ systemctl daemon-reload
$ systemctl start node_exporter.service
$ systemctl enable node_exporter.service
$ systemctl status node_exporter.service
5. Prometheus config 설정 (job 추가)
$ vi /etc/prometheus/prometheus.yml

  - job_name: "node-exporter"

    static_configs:
      - targets: ["localhost:9100"]
<Prometheus Target 확인> : Status -> Targets
Prometheus Sever IP : 9090

6. alertmanager 설치
1) 모니터링 대상 서버 생성 및 Node Exporter 설치 (vm명 : yjy-target-vm , 사설 IP : 10.0..60.6)


2) Prometheus config 설정 (타겟 추가)
$ vi /etc/prometheus/prometheus.yml

  - job_name: "node-exporter"

    static_configs:
      - targets: ["localhost:9100", "10.0.60.6:9100"]
<Prometheus 타겟 조회>

3) Alertmanager 설치

$ wget https://github.com/prometheus/alertmanager/releases/download/v0.27.0/alertmanager-0.27.0.linux-amd64.tar.gz
$ tar xvf alertmanager-0.27.0.linux-amd64.tar.gz
$ cp -r alertmanager /usr/local/bin
$ cp -r amtool /usr/local/bin
$ cp alertmanager.yml /etc/prometheus/
7. Alertmanaer 서비스 데몬 등록 및 실행
$ vi /etc/systemd/system/alertmanager.service
[Unit]
Description=Prometheus Alert Manager
Wants=network-online.target
After=network-online.target

[Service]
User=root
Group=root
ExecStart=/usr/local/bin/alertmanager --config.file=/etc/prometheus/alertmanager.yml

[Install]
WantedBy=multi-user.target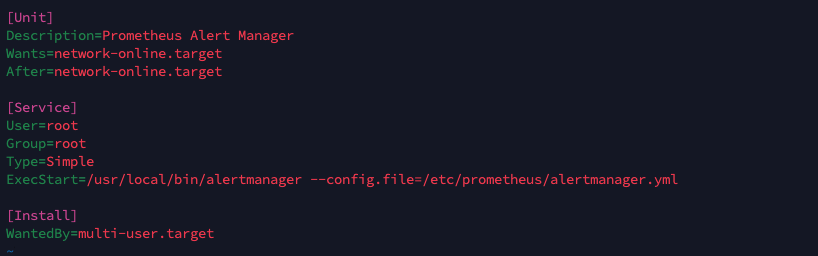
$ systemctl daemon-reload
$ systemctl start alertmanager.service
$ systemctl enable alertmanager.service
$ systemctl status alertmanager.service
8. Alertmanager config 설정 (slack 연동)
$ vi /etc/prometheus/alertmanager.yml
global:
  resolve_timeout: 5m

route:
  receiver: 'slack-notifications'
  group_by: ['alertname']
  group_wait: 30s
  group_interval: 5m
  repeat_interval: 3h

receivers:
- name: 'slack-notifications'
  slack_configs:
  - api_url: 'https://hooks.slack.com/services/....'    <<--- Slack webhook URL  생성 후 입력
    channel: '#kbo_webhook_test'  <<--- Slack channel 명 입력
    send_resolved: true
    text: |-
      *Alert:* {{ .CommonAnnotations.summary }}
      *Description:* {{ .CommonAnnotations.description }}
      *Details:*
      {{ range .Alerts }}
        *Alert:* {{ .Labels.alertname }}
        *Instance:* {{ .Labels.instance }}
        *Description:* {{ .Annotations.description }}
      {{ end }}
9. alertmanager rule 설정
$ vi /etc/prometheus/alert_rule.yml
groups:
- name: alertname
  rules:
  - alert: Node Exporter Down
    expr: up{job="node-exporter"} == 0
    for: 1m
    labels:
      severity: 'critical'
    annotations:
      summary: "{{ $labels.instance }} Node Exporter down"
      description: "{{ $labels.instance }} of job {{ $labels.job }} has been down for more than 1 minutes."
10. Prometheus config 설정 (alertmanager 설정 및 rule 파일 경로 추가)
vi /etc/prometheus/prometheus.yml
# Alertmanager configuration
alerting:
  alertmanagers:
    - static_configs:
        - targets:
          - localhost:9093

# Load rules once and periodically evaluate them according to the global 'evaluation_interval'.
rule_files:
  - "/etc/prometheus/alert_rules.yml"
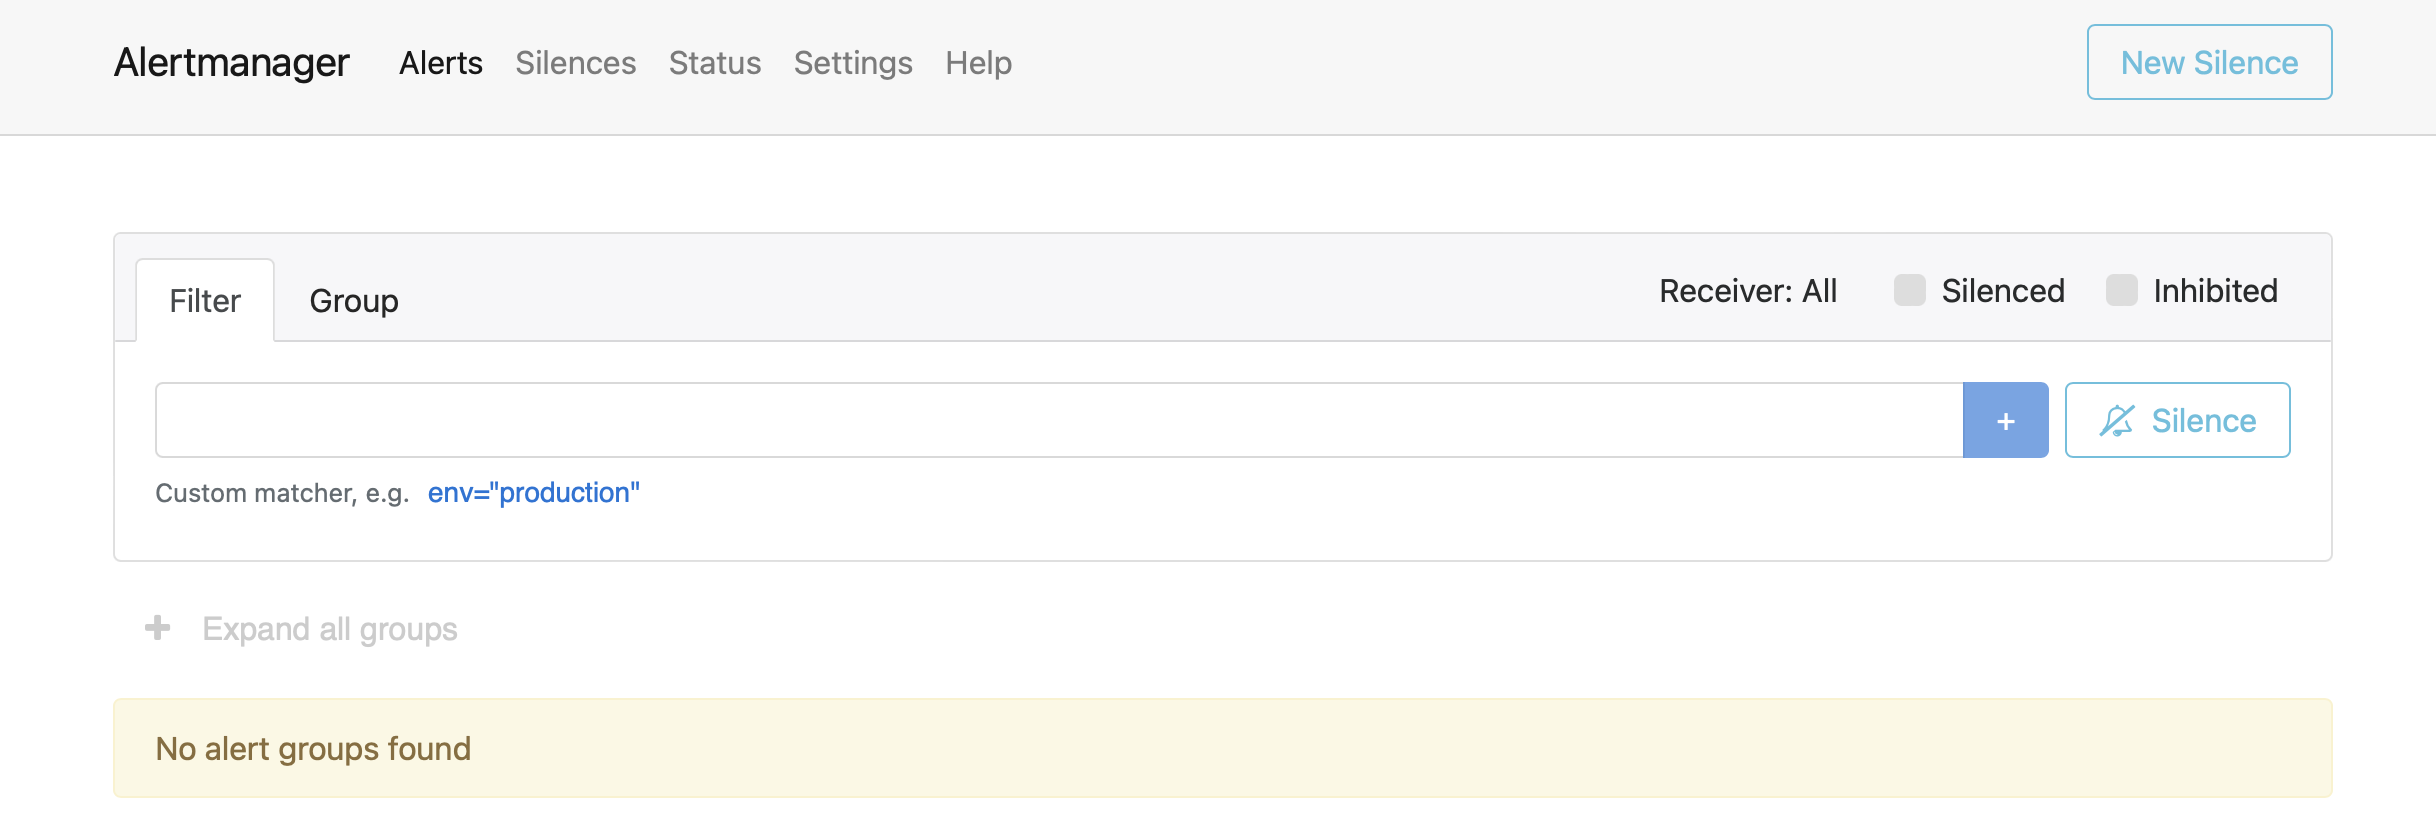
<Alertmanager 페이지 접속 확인> (해당 페이지에서 알람 Silences 설정 가능)
Prometheus IP : 9093
11. Alertmanager 알람 테스트
1) 타겟 서버 (10.0.60.6) 노드 익스포터 서비스 중지
$ systemctl stop node_exporter.service
<Prometheus 페이지에서 Alert 확인>

<Slack 알람 - Firing 확인>

2) 타겟 서버 노드 익스포터 서비스 재시작
$ systemctl restart node_exporter.service
<Slack 알람 -Resolved 확인>
